Skip To Main Content
Account
Settings
Logout
placeholder
Account
Settings
Logout
Filter:
All Files
Submit Search
What's New
Getting started with Insights
COVID-19 dashboard
Self Service
Getting started with Self Service
Reports
Accessing Visualizer
Help for first time users
Granting access to all users
How to work with reports
Add reports to a dashboard
Open a report from a dashboard
Formatting the data
Formatting Visualizer charts
Removing a column
Filters
Add and edit text
Add a button
Interactive dashboards
Show or hide titles and filter cards
Sorting data
Changing report types
Navigating between dashboards
Set the refresh rate
Geomap charts
Tabular and crosstab reports
Drilling and Hyperlinks
Dashboards and collections
Dashlets
Key Performance Indicator (KPI) Widgets
Data Dictionary
MFA
Release notes
Videos
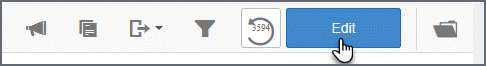
Open a report from a dashboard
On the Dashboard, click
Edit
.
Click the
report
to see the edit button.
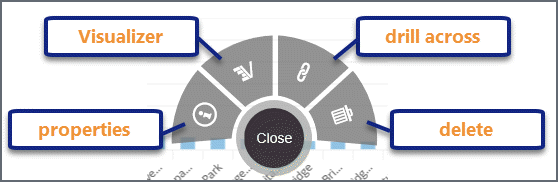
Click the
edit button
to see menu options.
Click the
Visualizer tab
to enter
Visualizer
.