COVID-19 dashboard
The COVID-19 Tracking dashboard will show patient encounter information that can help track activity potentially related to COVID-19.


Step 1: Set filtering criteria
Filters are the primary means by which you can control the display of the dashboard to meet your needs. There are filters for Symptom, Primary Impression, Secondary Impression, Complaint, Nature of Call, and Intervention.
By default, the dashboard is set to filter any encounters where the Primary Symptom contains the text “cough”, “fever”, “breath”, “respiratory”, “covid”, or “corona”.
This default setting for the Symptom field can be changed by altering the filter criteria search field.
- Example 1: To change the Symptom filter search for encounters that only contain the search term “fever” - delete all the search terms from that filter except “fever”.
In contrast, the Primary Impression, Secondary Impression, Complaint, Nature of Call, and Intervention filters, are not pre-configured to filter to any particular value. Checking a value in any one of these filters will activate that filter.
- Example 2: If you wish to search for all Primary Impressions that contains the search term “cough” - open the filter and select the check box that matches the Primary Impression value that contains “cough”.
Using multiple filters: When two (or more) filters are configured to search for particular values, the results returned are those that contain matches in both (all) configured filters.
When the Non-Transport filter is set, the dashboard will show only those encounters where a transport did not take place.
Code impressions for COVID-19 (recommended)
While you not required to use this dashboard, in accordance with guidance from the CDC, ZOLL is recommending coding specific impressions for suspected cases of COVID-19. The predominant EMS interaction with patients who are suspected to have COVID-19, would fall under the following ICD-10 code:
- Z20.828, Contact with and (suspected) exposure to other viral communicable diseases (can be used in suspected exposure)
When configuring this impression in RescueNet ePCR Tablet, we recommend providing an associated Display Name of “COVID-19 (Suspected)” so it can be easily found by your medics.
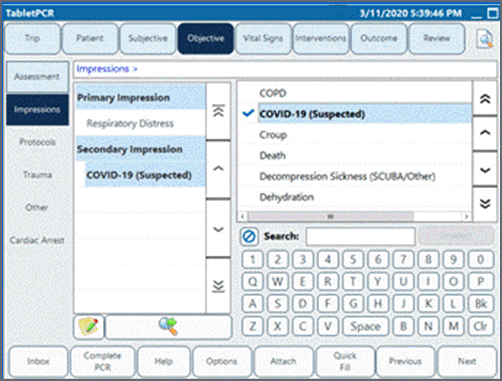
Once this display name is configured, and data is synchronized with ZOLL Online, that impression Display Name will be available on the dashboard filters for Primary Impression and Secondary Impression. They can then be used as additional filter values on the dashboard.
Step 2: Visualize dashboard data
The dashboard is configured to show patient encounter details using the following visualizations:
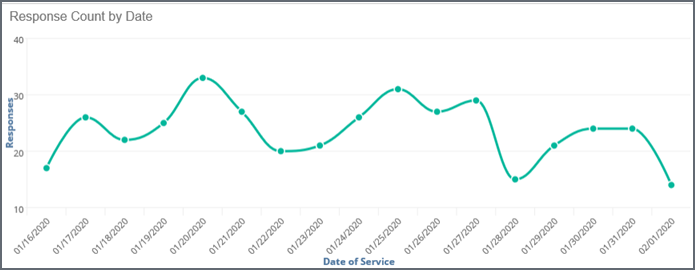
- Response Count by Date: Line graph that shows response count trends over time. Each data point represents the number of responses that match the potential COVID-19 related filtering criteria for a given date. Scroll the graph fully to the right to see the most recent dates.
- Patient Encounter Hotspots (Map): Map that plots a marker corresponding to geographical location (lat/lon) of all encounters in the date range meeting the filtering criteria. Zoom in to your agency's geographical area to see individual markers and their clustering relative to encounters.
Note: This map depends on available latitude and longitude information in your RescueNet data set.
- Transports by Destination Facility: Chart that shows facilities receiving the most transports from your agency in the date range meeting the filtering criteria.
- Transports by Destinations (Map): Map that plots a marker corresponding to geographical location (lat/lon) of the transport destinations in the date range meeting the filtering criteria. Zoom into your agency's geographical area to see individual markers and their clustering relative to other encounters.
Note: This map depends on available latitude and longitude information in your RescueNet data set.
- Encounter Details (scroll down to see this table): Tabular report that shows individual runs meeting the filtering criteria. Data includes Run Number, Primary Symptom, Primary Impression, Secondary Impression, Complaint, Nature of Call, Intervention, Incident Address, Incident City, Lat/Lon and Transport (indicator if a transport occurred or not).
Hint: Drag highlight individual run numbers to filter the entire dashboard to show information related to just those runs.
- Crew Member Activity: Shows crew members and run number for patient encounters that meet the filtering criteria.
Hint: To show information related to runs for a crew member, re-sort the table by crew member, then drag highlight all runs in which the crew member participated to filter the entire dashboard.
- Top Symptoms: Bar graph that shows top symptoms according to the filtering criteria.