Getting started with Insights
Insights gives your company access to critical business information in an easy-to-understand format through the use of dashboards.
Dashboards are interactive web pages that contain analytical information that can communicate information needed to help you reach the objectives of your company. They are easy to create, customize, and share. Analytical or operational data can display in a form of a table, line chart, bar chart, or gauge. You to monitor many metrics in near real-time, so you can quickly check the health of an area of concern, or see a correlation between different reports.
Take a couple of minutes and watch this overview video. Then, read the rest of the information in this section, it will give you some basics to help you get started.
What makes up a dashboard
A Dashboard has pages with dashlets that hold your reports and prompt filters, key performance indicator (KPI) widgets, drill-across links, images, buttons, and text boxes.
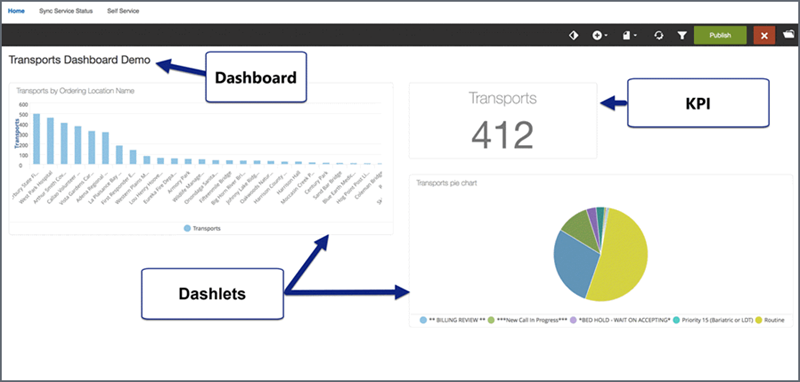
Dashlet: A dashlet is a container that holds a report. Reports are created by a users with special permissions. A dashlet can contain a title, borders, and drill-across capability that links the report to a report in another dashboard.
KPI widget: A KPI widget displays a basic number of a measure or expression. You can choose from many options when creating a KPI widget.
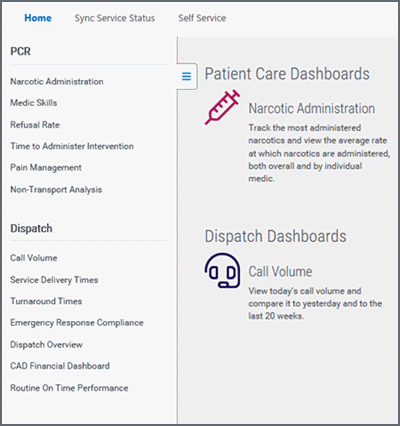
Home - PCR and dispatch dashboards
On the Home page, there is a number of RescueNet PCR and Dispatch dashboards that are already created and available for your use.
The following video goes over all the pre-made dashboards that come with Insights, what they provide, and how you can use them.
Using filters
Fast way to load a dashboard
Self Service
Self Service gives you the ability to create custom dashboards. You must have special permission to access Self Service.
The Self Service landing page displays the default dashboard which is the first dashboard in the first collection.
Many times in this guide you will see the term 'Edit Mode'. This means that you have clicked 'Edit' and are now in the area that allows you to create or modify dashlets, reports, KPIs, etc. To remind you that you are in the Edit Mode, the toolbar highlights black and the Publish button displays. You must click the Publish button to save the changes/additions you made in Edit Mode.
Grant permissions
Company Administrators grant user's permission to view and create reports. The permissions are set in Admin > Insights > User Accounts.
- Log onto ZOLL Online.
- In the navigation bar, click Admin.
- Click Insights.
- Click User Accounts.
- For the user account:
- If the user does not exist, click 'Add new user'. Enter the user's information at the top and select an account type (Company Administrator or Standard user).
- If the user already exists, scroll down the list or search for the user's name. When found, click the name.
- On the User Account page, scroll down the list of products until you find the product block that reads "Insights roles & permissions".
- Set the 'Product access' to Yes.
- Content Viewer: Able to view Patient Care and Dispatch dashboards.
- Content Creator: In addition to viewing dashboards, a Content Creator can build/modify reports, KPIs, etc., using Self Service.
- Click Save.
Browser loading behavior and performance
Dashboards are comprised of groupings of individual reports that query the database. Web browsers have certain limitations. If your dashboards contain many reports, the web browser you select will have an impact on how quickly the dashboard reports update. Because these limitations, when designing your dashboards consider creating dashboards with fewer reports rather than one large dashboard with many reports. The loading time for each dashboard will be enhanced as will your user's experience when viewing those dashboards.