Analytics Best Practices, Recommendations, Tips and Tricks
Best practices
Review the PDF below for some Analytics best practices. You can also download or print the PDF for offline use.
Recommendations and tips for using Analytics
-
Save your work as you go.
-
There are two different user interface's (UI's) for building reports: the standard UI and the instant report UI. They both offer the same functionality but have different layouts. Use the one you like best.
-
Use the Advanced Settings option when editing reports to configure advanced field properties and add custom expressions.
-
Open existing reports and save a copy with a different name so you can customize them without making changes to the original.
-
Use access rights to fully control who has what access to your reports.
-
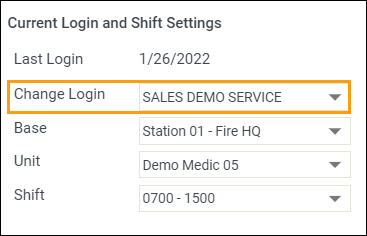
Change your login type (service, command facility, hospital, region, etc.) to report on the data you need.
Note: To change your login type for Analytics you must first access Analytics under your service.
-
After opening Analytics under your service account, open a new browser tab or window and log back into ZOLL emsCharts Web.
-
On your home page, you can change your login type to a command facility, hospital, region, or other type you wish to include data for in your reports.
-
Go back to your analytics tab or window after changing your login type and click 'Refresh Session *'. The page will reload and update with the ID of the login type you are now under and your report results will reflect the new set of data.
Notes:
-
The letter before the account ID in analytics tells you the type of account you are currently reporting on.
-
S = service
-
C = command facility
-
H = hospital
-
R = region
-
-
-
Tips and tricks for creating reports
Use the following information to perform specific functions when creating or customizing reports.
General functions
-
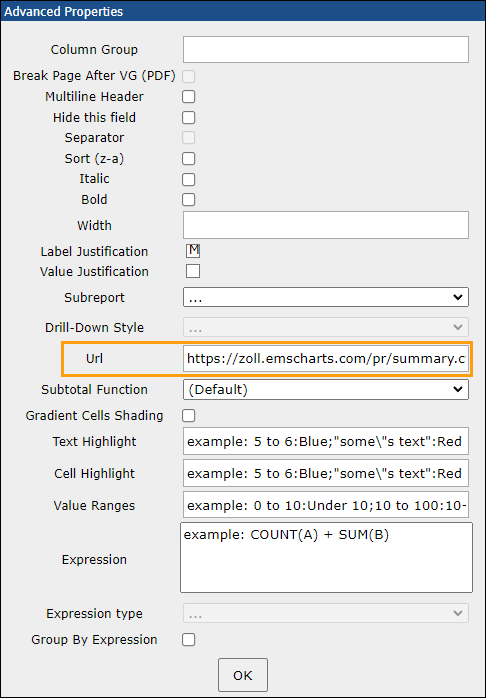
PRID link: Adding the ePCR link will enable a hyperlink in the report summary to direct the user to the PRID in question.
[ ZOLL UI ] URL: https://ZOLL.emscharts.com/pr/summary.cfm?prid={0}
[ LEGACY UI ] URL: https://www.emscharts.com/pr/summary.cfm?prid={0}
Note: Configure the URL in the PRID field Advanced Settings on the Fields tab when creating or customizing a report with PRID data.
-
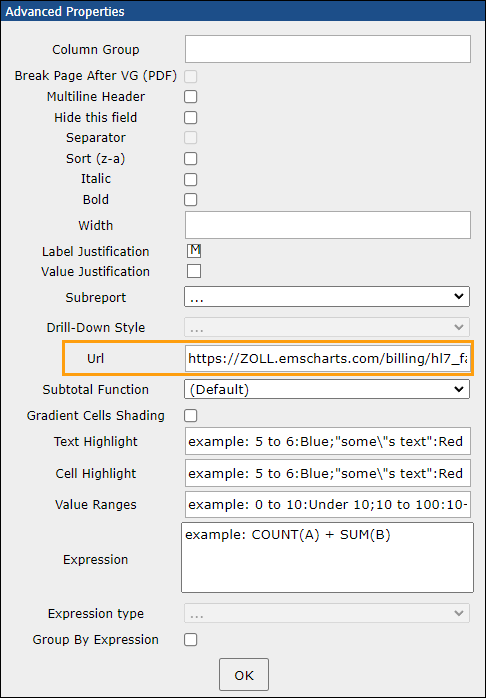
Hospital face sheet link: Links directly to the hospital face sheet associated with the ePCR.
URL: https://ZOLL.emscharts.com/billing/hl7_face.cfm?hl7id={0}
Notes:
-
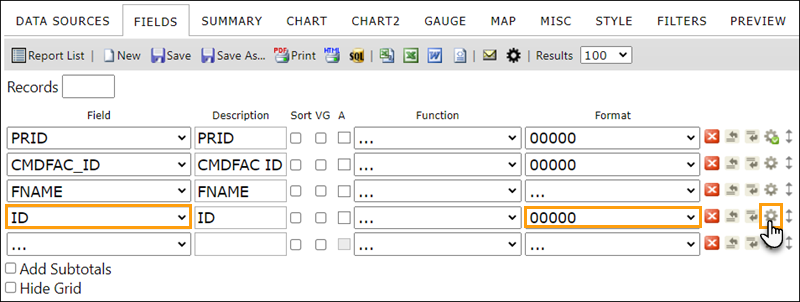
Configure the URL in the ID field Advanced Settings on the Fields tab when creating or customizing a report with HL7 data.
-
Make sure the format is 00000.
-
-
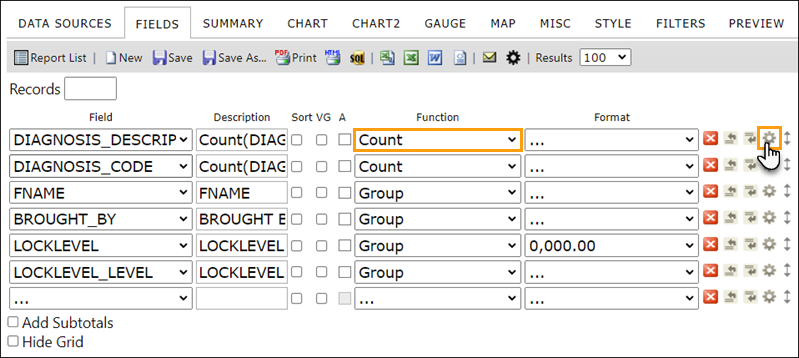
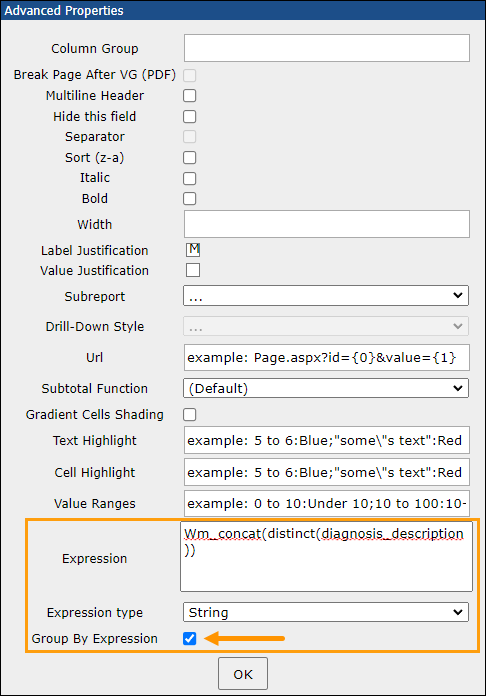
WM Concat: Aggregates data from multiple rows to a single row, giving a list of data associated with a specific value.
Expression: Wm_concat(distinct(XXXXXXXXXX))
Notes:
- The fields being aggregated must be set to the Count function.
- Make sure to check the Group By Expression checkbox.
-
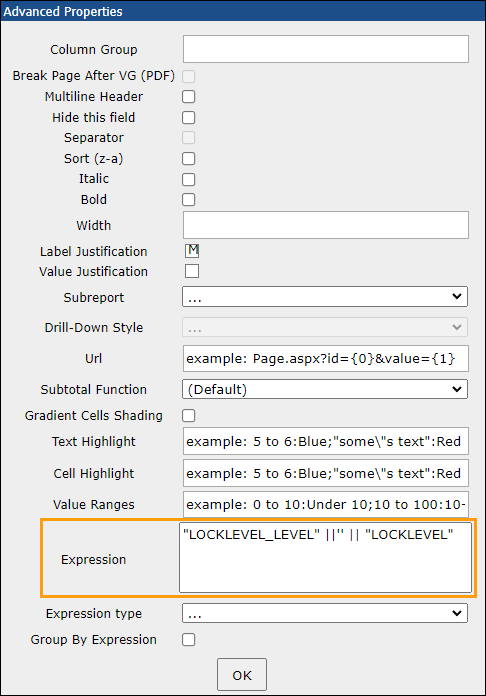
Merging two fields: Combines two database fields into one. A good example is a QA level where the Locklevel level is the origin (S=Service, C=Command, R=Region, etc.) and the number is the QA level.
Expression: "LOCKLEVEL_LEVEL" ||'' || "LOCKLEVEL"
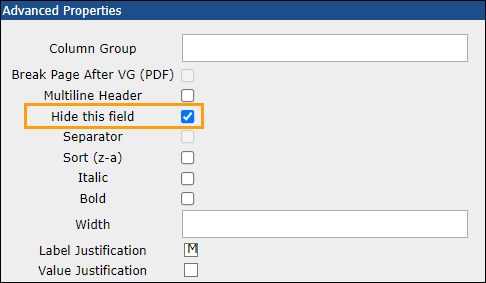
Note: Hide one of the merged fields.
-
Decode ASA
Expression: sum(decode(procedure_type,'Aspirin',1,0))
Value Ranges: 0:No;1 to 1000:Yes
-
Percent of unmatched charts
Expression: COUNT("RPT_DIST"."HL7_MAIN"."PRID")/COUNT("RPT_DIST"."PCR_MAIN"."PRID")
Time calculations
-
Time to first procedure
Expression: min(distinct(case when instr(upper(procedure_type), 'NITRO') > 0 then ROUND( (DT-DT_ATPT) * 1440 ) end))
-
Annualize 30 day volume
Expression: Round([DAY30_VOLUME] * (365/30),0)
-
Age custom expression:
-
when age_yrs between 0 and 20 then '0 to 20'
-
when age_yrs between 19 and 45 then '20 to 44'
-
when age_yrs between 44 and 55 then '45 and 54'
-
when age_yrs between 54 and 65 then '55 and 64'
-
when age_yrs between 64 and 80 then '65 and 79'
-
when age_yrs > 79 then '80+' else 'Not Documented by Clinician' END
-
-
Manual time conversions: The results of manual time calculations by subtracting two time values are returned in days.
-
To convert to minutes, multiply the result by 1440.
-
To convert to hours, multiply the result by 24.
-
-
Calculated time fields conversions: The results of calculated time fields are returned in minutes.
-
To convert to hours, divide by 60.
-
To convert to days, divide by 1440.
-
-
Display times in HH:MM:SS format
-
Manual time interval calculations Expression:
TO_CHAR(TIME'0:0:0'+NUMTODSINTERVAL(("<INSERT END TIME FIELD HERE>"-"<INSERT START TIME FIELD HERE>"), 'day'), 'hh24:mi:ss')
-
Calculated time field interval Expression:
TO_CHAR(TIME'0:0:0'+NUMTODSINTERVAL((<INSERT CALCULATED TIME INTERVAL HERE>), 'minute'), 'hh24:mi:ss')
Note: The difference between the manual and calculated times field Expressions is that the NUMTODSINTERVAL Function needs the unit that the value is providing. Manual calculation results are returned in days and calculated times fields are returned in minutes.
-
-
Common calculated times:
-
chute_time = dt_enroute - dt_disp
-
response_time = dt_arrive - dt_enroute
-
scene_time = dt_lvref - dt_arrive
-
transport_time = dt_arvrec - dt_lvref
-
turn_time = dt_available - dt_arvrec
-
total_time = dt_available - dt_disp
-
dt_locked = the first audit_locklevel.dt
-
created_to_lock = dt_locked - created_when
-
dispatch_to_lock = dt_locked - dt_disp
-
bedside_time = dt_lvpt - dt_atpt
-
