Analytics Overview and How to Enable It
ZOLL emsCharts Analytics is a platform that combines multiple data sources - electronic patient care reports, computer aided dispatch, Fire Reports, and hospital - into one data warehouse so you can use customizable visualizations to present the data in meaningful ways. You can combine multiple analytics reports into dashboards to view performance metrics.
Some key features:
-
You have access to several canned reports already built and ready to use.
-
You can create custom reports and combine multiple reports into a dashboard.
-
You can change your login type (Service, Command Facility, Hospital, Region, etc.) to report on the specific data you need.
-
You can set up access rights at the report level to fully control who has what access to each and every report.
Go here to see some report examples along with the configurations you need to build them.
Go here for some helpful hints for building reports.
Watch this video for more information about analytics and steps to enable it.
How do I enable Analytics?
You must have the Service Administrator role to access the following configurations. Consult with your administrator if you don't have access.
-
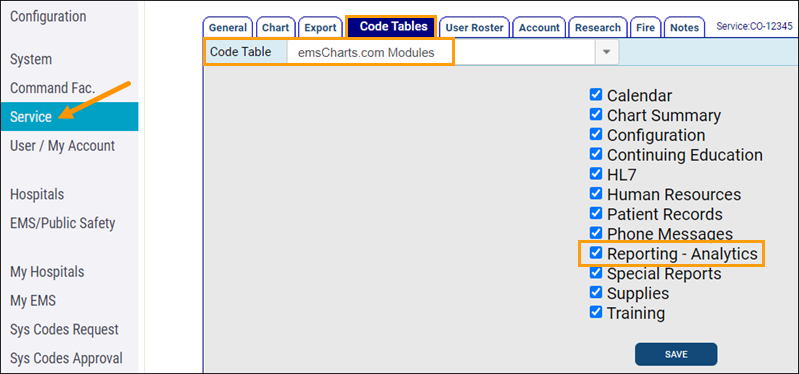
Go to Configuration > Code Tables > emsCharts.com Modules and check the 'Reporting - Analytics' option.
-
Click SAVE.
-
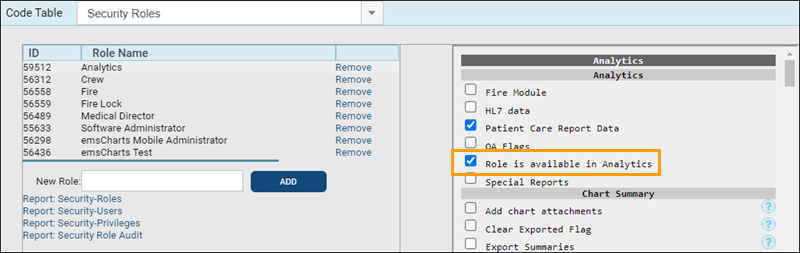
Give your users access by going to Configuration > Code Tables > Security Roles, select the group to give access and check the box under Analytics labeled 'Role is available in analytics'. You can also check the boxes for any of the additional analytics access you want the group to have.
-
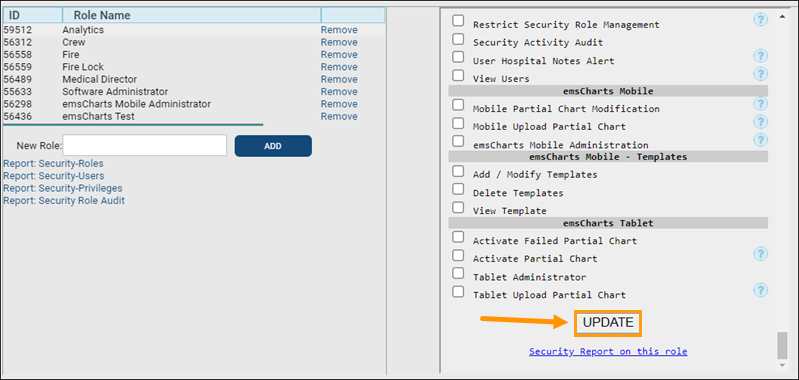
Scroll to the bottom of the permissions window and click UPDATE.
Learn how to create basic reports and dashboards.