Insights
Insights gives you access to critical business information in an easy-to-understand format through the use of dashboards. A dashboard is an interactive web page that contains analytical information that can communicate information needed to help you reach company objectives. Analytical or operational data can display in a form of a table, line chart, bar chart, or gauge. Use dashboards to monitor metrics in near real-time so you can quickly check the health of an area of concern or see a correlation between different reports.
A dashboard can be made up of many parts such as small reports (called dashlets), key performance indicators (KPI), drill-across links, images, buttons, and text boxes. Insights uses terms that may not be familiar to you so let's clarify what they are:
-
Dashlet: This is a small container that holds a report. ZOLL Billing created a number of dashlets that you can use when creating your own customized dashboard. In Insights, the term dashlet and report are synonymous. To make the creation of custom dashboards easy for ZOLL Billing, a number of dashlets have been created for your use.
-
KPI: This is a widget that displays a basic number based on a measure or expression.
-
Migration reports: Agencies migrating from RescueNet to ZOLL Billing have expressed the need to have reports, similar to RescueNet, for ZOLL Billing. There is a list of migration reports available in Insights.
How to access Insights in ZOLL Billing
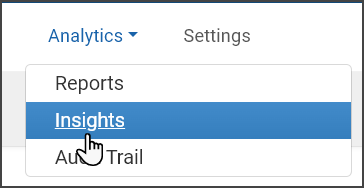
Insights can be accessed directly from ZOLL Billing by clicking Analytics on the navigation bar.
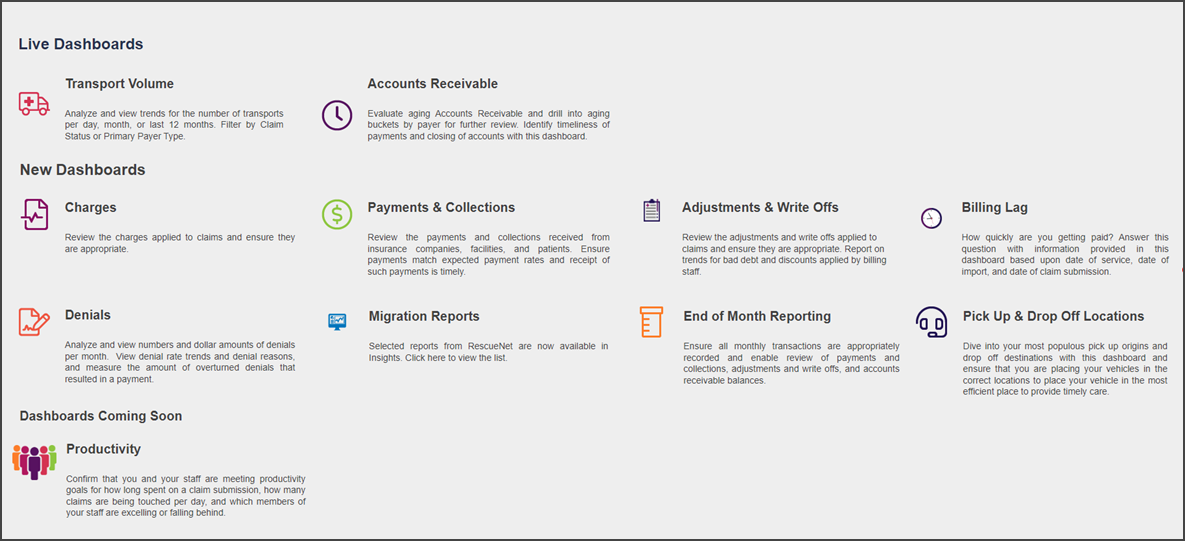
After loading, the Insights Billing Dashboard landing page will display a number of reports that are ready for your use.
ZOLL Billing dashboards
The following shows a list of available pre-configured Billing dashboards. Click the dashboard name in the list below for details on what each dashboard offers.
Creating custom dashboards
To make creating your own dashboards easier, we created a number of small reports or dashlets that you can use. Using the following steps, select one, or many dashlets to create a single dashboard. For a list of dashlets at your disposal, click here.
-
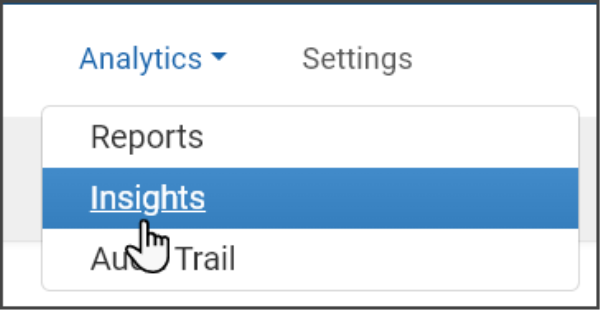
In ZOLL Billing, click Analytics on the navigation bar and then click Insights.
-
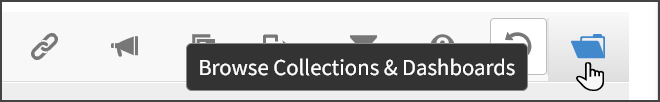
After the landing page displays, navigate and then click the file folder on the far right.

-
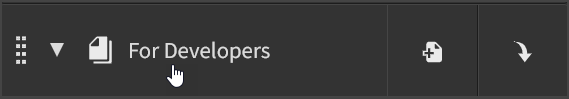
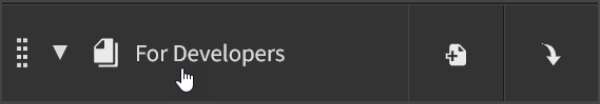
Scroll down and then hover over "For Developers." Click the paper plus sign. If you, or others, have created and then saved a dashboard, it will display in this section.
-
Enter the name of the new dashboard and then click the check mark.
-
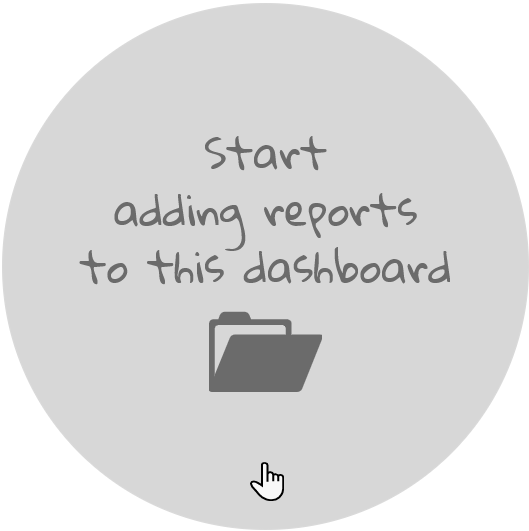
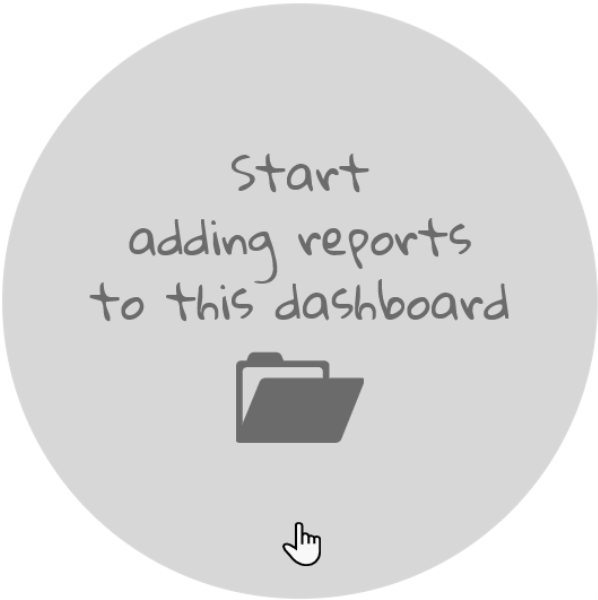
Click "Start adding reports to this dashboard."
-
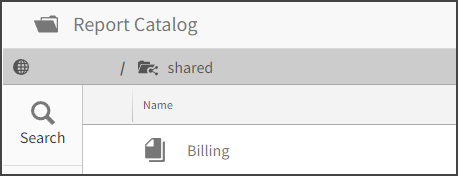
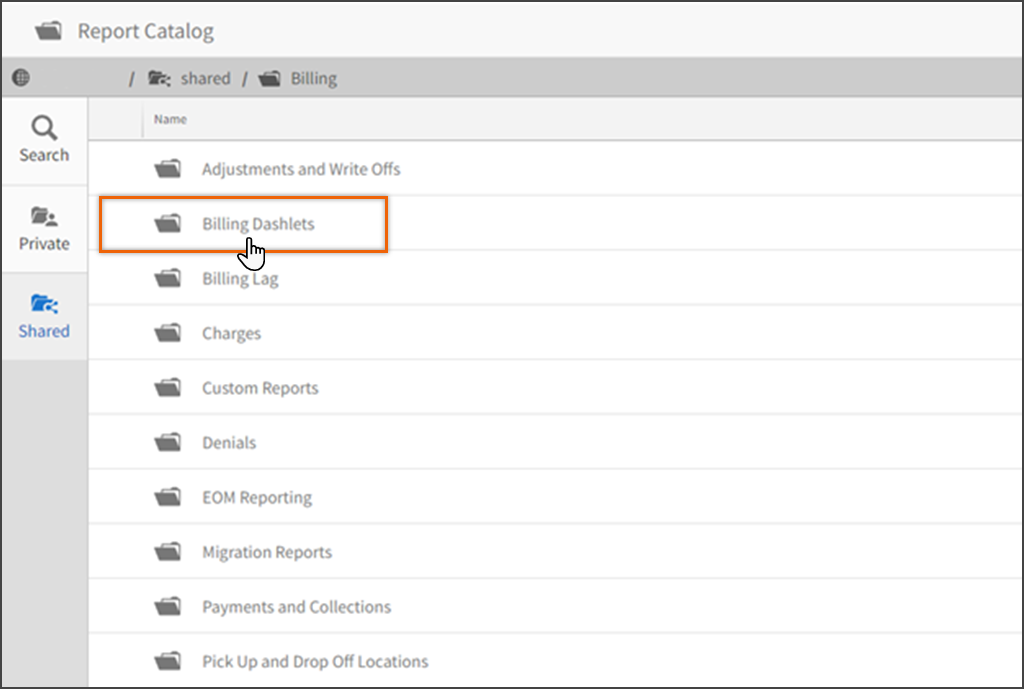
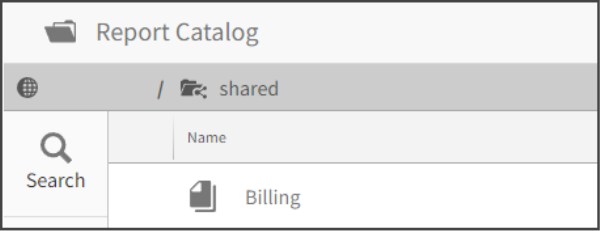
On the Report Catalog page, click Billing.
-
From the list that displays, click Billing Dashlets.

-
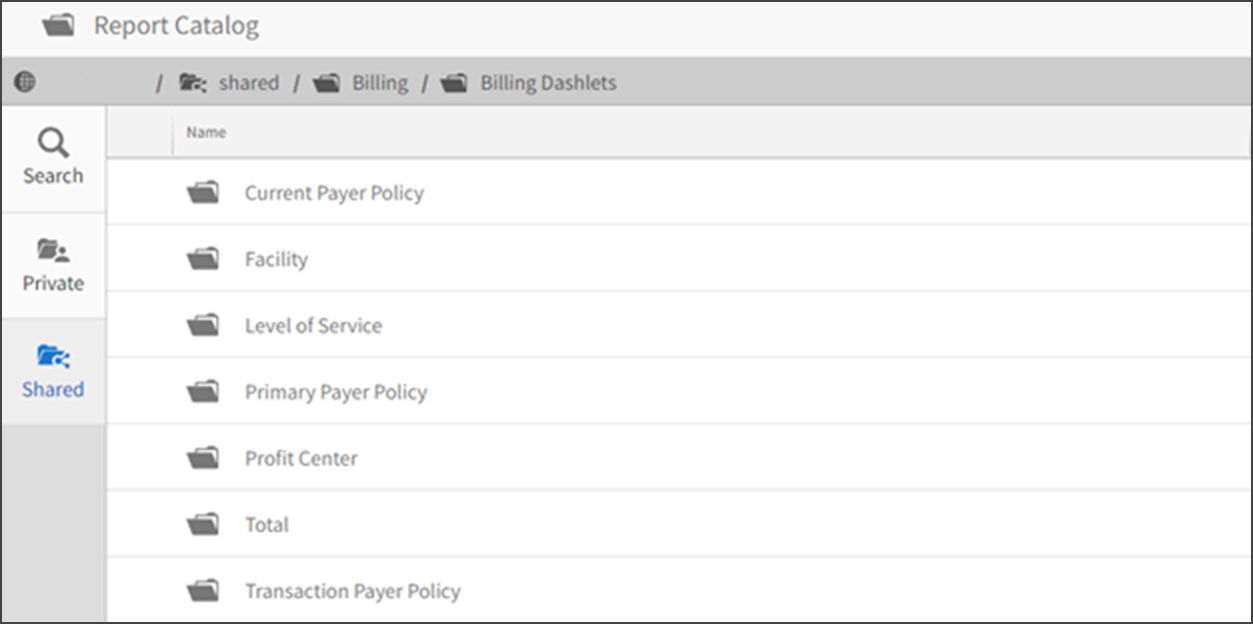
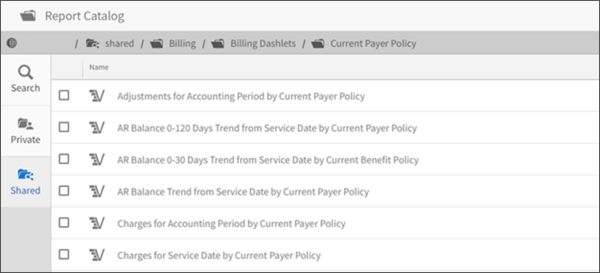
The next page will display folders by categories. Find the category you wish to use and then click that folder.

-
A list of small reports or dashlets that pertain to that category will display. You can check one, or multiple reports to display on the dashboard. When you are done selecting, scroll down and select Done.
-
The reports will display on in the middle of the dashboard.

-
In this next step, you will add a date picker to your dashboard. If you do not do this step, the dashlets will show data for all dates in the database which could make it overwhelming to find the data you need.
-
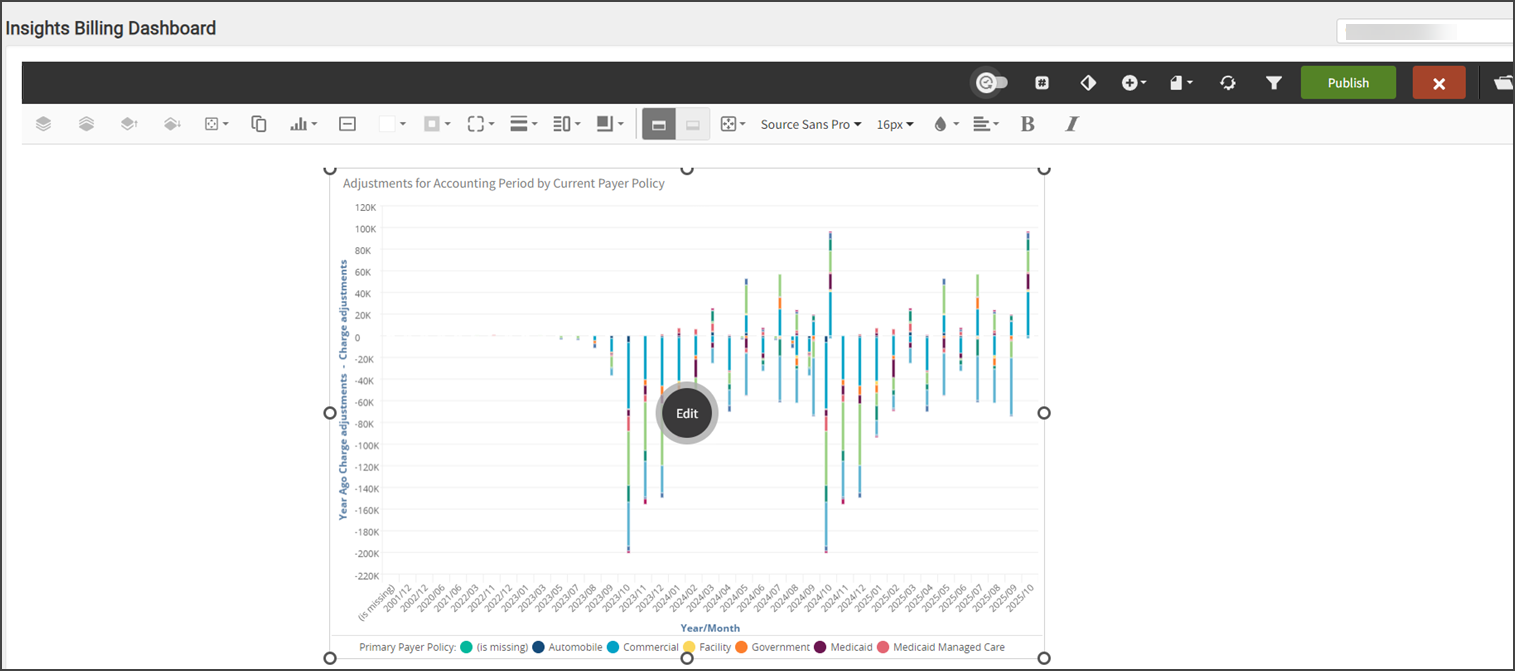
Click the Publish button. Don't worry, others will not be able to see your work.
-
Click the Edit button.
-
Click the filter icon
 .
. -
Click Manage.
-
Click the plus icon.
-
Click Native Filter.
-
Click the stacked icon to the right.
-
Click Billing Claim.
-
Click Attributes.
-
Scroll down and then click Service Date.
-
This is the place you will create your filter. Click the Advanced button.
-
The Date Picker option is the one you want and is selected by default. Leave that option as is.
-
Click the drop-down field and then select "Between."
-
Scroll down to the bottom of the page and click Save Filter.
-
Check the box to the left of the filter name to apply it to your dashboard.
-
Now, drag the filter to your dashboard so users can access it.
-
-
With the date picker filter on the screen, you can now rearrange the reports by dragging and dropping them on the page.
-
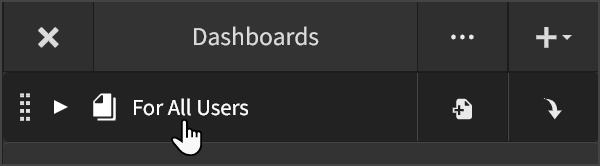
When you are done with the changes, click Publish. Your new dashboard will now be available under "For All Users."